May 16, 2025

FacebookTwitterInstagramYouTube
  • Home
  • Events
  • NEWS
    • Top Stories
    • National News
    • National Sports
  • Current Contests
  • Photos/Video
    • Photos
    • Videos
  • On-Air
    • Kat & Ku`ehu
    • G. Cruz
    • Kaohu James
  • Podcasts
    • KWXX Mauna Loa Eruption Updates
    • Island Conversations
    • COVID-19 Interview
  • Contact
  • Info
  • Search
  • FCC Applications
MENU
  • Home
  • Events
  • NEWS
    • Top Stories
    • National News
    • National Sports
  • Current Contests
  • Photos/Video
    • Photos
    • Videos
  • On-Air
    • Kat & Ku`ehu
    • G. Cruz
    • Kaohu James
  • Podcasts
    • KWXX Mauna Loa Eruption Updates
    • Island Conversations
    • COVID-19 Interview
  • Contact
  • Info
  • Search
  • FCC Applications

USGS releases video, map of Kīlauea from Wednesday

December 31, 2020 at 6:18 am Updated: December 31st, 2020 at 12:57 pm sbracken
  • Blogs
  • Eruption Update
  • Tweet
  • Share
  • Reddit
  • +1
  • Pocket
  • LinkedIn
20201230thermalmap
This short video, taken by USGS HVO scientist Matt Patrick, is from a helicopter overflight of Kīlauea summit eruption on December 30, 2020, around 10:00 a.m..  It shows the western vents (area of bluish-colored gas emissions on left) erupting through crusted-over channels into a lava lake within Halema’uma’u crater.As of December 30, at 3:45 a.m., the lava lake was 181 m (593 ft) deep. The lake volume was about 23 million cubic meters (30 million cubic yards or 5.2 billion gallons). The most recent measurement of the lake shows that it covers an area of 29 ha (72 acres). The large “raft” in the center of the lava lake is about 250 m (820 ft) in length, 135 m (440 ft) in width, and about 3 ha (7 acres) in area.Visual and thermal images collected during the overflight are used to map the ongoing activity and assess hazards during the eruption.

https://prd-wret.s3.us-west-2.amazonaws.com/assets/palladium/production/s3fs-public/atoms/video/2020_Dec_30_Overflight_10AM.mp4


Video courtesy USGS Hawaiian Volcano Observatory, taken by USGS HVO scientist Matt Patrick.

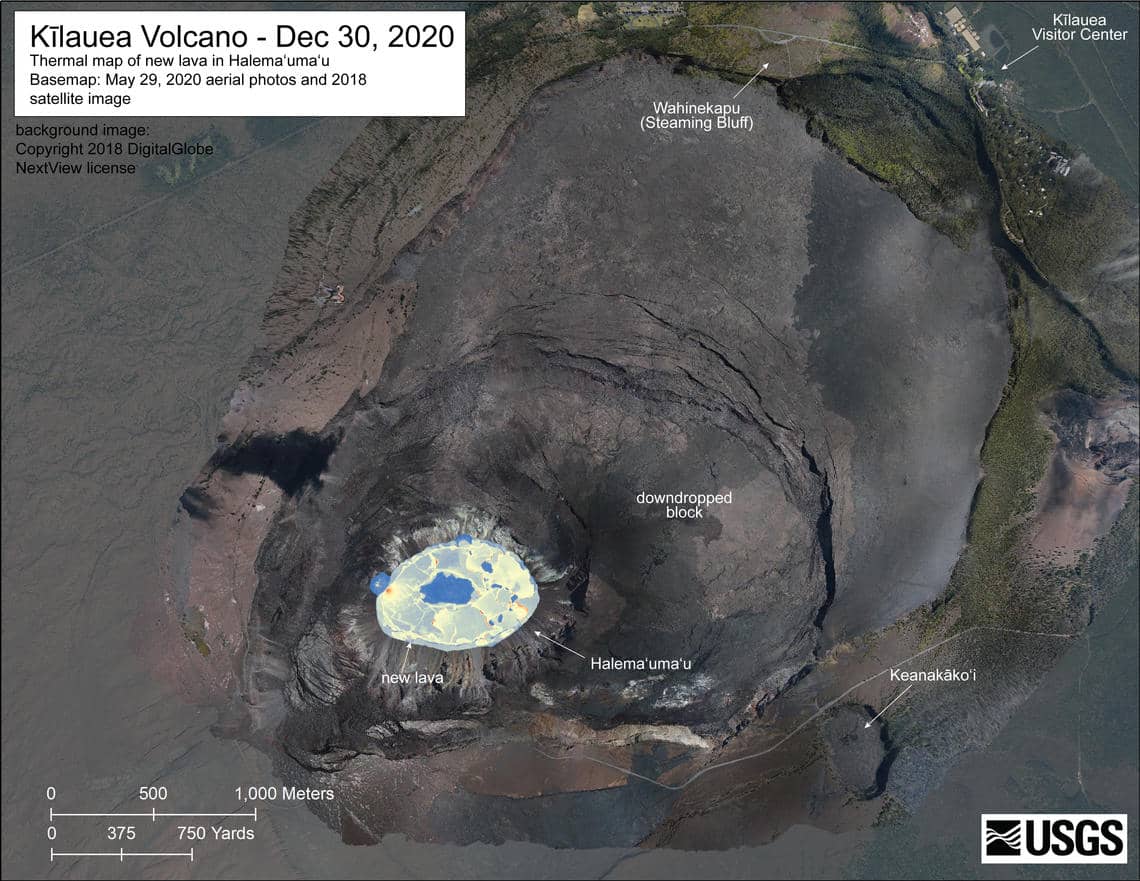
Attached image is a thermal map constructed from the video imagery. The scale of the thermal map ranges from blue to red, with blue colors indicative of cooler temperatures and red colors indicative of warmer temperatures.  Click on map to enlarge.  Mapp by Matt Patrick, USGS HVO


Tags: Kilauea Eruption
Previous Story
Last day of year sees highs in COVID cases, deaths
Next Story
Gov Ige ok’s Kauai plan for tests, quarantine, resort bubbles

Facebook

Twitter

Tweets by KWXX

"Hawaii's Feel Good Island Music Radio Station"

Info

  • Home
  • Contests
  • Socialize
  • Contact Us
  • Station Info
  • EEO
  • FCC Public File (KWXX)
  • FCC Public File (KAOY)

National News

Sign in support of Milwaukee Judge Hannah Dugan at a May Day march for workers' rights in Lower Manhattan. NEW YORK^ NEW YORK USA - May 1^ 2025

Wisconsin Judge Hannah Dugan pleads not guilty to federal obstruction charges

US Supreme court building on the capitol hill in Washington DC^ United States of America

Supreme Court expresses concern over Trump’s birthright citizenship plan amid ...

Social

Facebook Facebook Twitter Twitter Instagram Instagram YouTube YouTube
© 2025 KWXX - Hilo, HI Powered by OneCMS™ | Served by InterTech Media LLC
Are you still listening?
316279021
Mozilla/5.0 AppleWebKit/537.36 (KHTML, like Gecko; compatible; ClaudeBot/1.0; +claudebot@anthropic.com)
0eba53bf063c905439a64664e60eeb31ac409933
1
Loading...